Utiliser un programme Java dans R grâce au package rJavaUse a Java program in R thanks to the rJava package
Ce tutoriel n’existe qu’en anglais…
In this post, I explain how to use a Java program directly in
R. As an example, I will use the Java program, clustering.jar, available here (jar file and documentation) to cluster the vertices of my facebook network (or, more precisely, of its largest connected component): the example dataset can be downloaded here (and was extracted as explained in this post found on R blogger. This tutorial was made possible thanks to the help of Damien (also known as bl0b) who explained me how to use the rJava package.
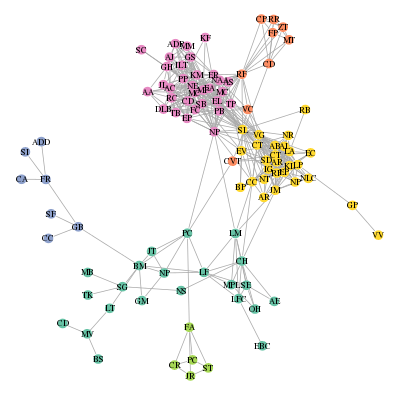
This post will show you how to cluster a graph and how to display it accordingly to the clustering:

I hope that all of my (facebook) friends can find themselves on this picture and are happy with their group… 😉
Pre-requisites
-
What you need to use Java in R is a first a proper Java environment installed on your computer. If you are a linux or a Mac OS X user, you can check it by using the command
java -version
which should give you something like
java version "1.6.0_24"
OpenJDK Runtime Environment (IcedTea6 1.11.4) (6b24-1.11.4-1ubuntu0.12.04.1)
OpenJDK Server VM (build 20.0-b12, mixed mode)
If you are a Windows user, well…, GIYF (but not me);</li>
- also, you need the R package rJava to be installed so that R can use the Java environment;
- finally, if you want to be able to run my example, you also need the R package igraph to handle graphs in R. </ul>
How does it work?
First, the function
.jinit()
is used to initialize the Java Virtual Machine. It has to be called before any other function of the package. Then,
.jaddClassPath('clustering.jar')
adds the jar file clustering.jar to the class path. Finally, the function J can be used to call a Java method. To be able to see which Java class reference you have to pass to this function, you can use the following command line in a terminal (if you are a linux or a Mac OS X user)
jar -t clustering.jar
which gave me
META-INF/MANIFEST.MF
org/apiacoa/graph/clustering/DoCluster.class
org/apiacoa/graph/clustering/GraphClusteringParameters.class
org/apiacoa/graph/clustering/SignificanceMergePriorizer.class
org/apiacoa/graph/clustering/MergePriorizer.class
org/apiacoa/graph/Graph.class
gnu/trove/TIntObjectHashMap.class
...
giving me a clue (well, really, giving Damien a clue) about the fact that the main class might be called ‘org.apiacoa.graph.clustering.DoCluste‘. Hence, I can use this jar file in R by
J('org.apiacoa.graph.clustering.DoCluster', 'main', c(...))
where c(...) is the list of parameters that has to be passed to the jar program, as described in the documentation of the program:
J('org.apiacoa.graph.clustering.DoCluster', 'main', c('-graph', graph.file, '-part', tmp.part, '-recursive', '-mod', tmp.mod, '-random', '100'))
for instance.
Finally, how to use it?
In my case, the jar file takes as an input a text file (containing the edge list of the graph, graph.file in the example above) and produces one or two text files (containing the clustering and the value of the modularities tmp.part and tmp.mod in the example above). So I used it as follows:
-
I extracted the list of edges using the function
get.edgelist(igraph) and exported it in a text file (in the working directory); -
I created one or two temporary files names using the function
tempfile()to export the results; -
I read the temporary files from R and deleted them using the function
unlink.
which finally gave me the following function to use most of the options of the initial jar file directly in an R function:
## Requires rJava, igraph
do.hierarchical.clustering = function(a.graph, reduction=0.25, verbose=0, debug=0, random=NULL, recursive=FALSE, termination='significance', minsize=4, recrandom=50, weights=NULL) {
  if (is.null(weights)) {
    el = get.edgelist(a.graph)
  } else {
    el = data.frame(get.edgelist(a.graph),get.edge.attribute(a.graph,weights))
  }
  write.table(el,row.names=FALSE,col.names=FALSE,file='tmp.el.txt')
  tmp.part = tempfile()

  .jinit()
  .jaddClassPath('clustering.jar')
  if (is.null(random)) {
    if (recursive) {
       J('org.apiacoa.graph.clustering.DoCluster', 'main', c('-graph', 'tmp.el.txt', '-part', tmp.part, '-reduction', reduction, '-verbose', verbose, '-debug', debug, '-recursive', '-termination', termination, '-minsize', minsize, '-recrandom', recrandom))
    } else {
      J('org.apiacoa.graph.clustering.DoCluster', 'main', c('-graph', 'tmp.el.txt', '-part', tmp.part, '-reduction', reduction, '-verbose', verbose, '-debug', debug))
    }
  } else {
    tmp.mod = tempfile()
    if (recursive) {
       J('org.apiacoa.graph.clustering.DoCluster', 'main', c('-graph', 'tmp.el.txt', '-part', tmp.part, '-reduction', reduction, '-verbose', verbose, '-debug', debug, '-random', random, '-mod', tmp.mod, '-recursive', '-termination', termination, '-minsize', minsize, '-recrandom', recrandom))
    } else {
      J('org.apiacoa.graph.clustering.DoCluster', 'main', c('-graph', 'tmp.el.txt', '-part', tmp.part, '-reduction', reduction, '-verbose', verbose, '-debug', debug, '-random', random, '-mod', tmp.mod))
    }
  }

  mod = NULL
  part = read.table(tmp.part,row.names=1)
  part = part+1
  names(part) = paste('h',1:ncol(part),sep='')
	unlink(tmp.part)
  if (!is.null(random)) {
    mod = read.table(tmp.mod,stringsAsFactors=FALSE)
    unlink(tmp.mod)
    names(mod) = c('modularity','type')
  }
  unlink('tmp.el.txt')
  list('part'=part,'mod'=mod)
}
I can be used to cluster the vertices of my facebook network (the igraph object is called fbnet in this Rdata file; it models an unweighted graph so the argument weights in the R function must be equal to NULL) by
# basic clustering
res1 = do.hierarchical.clustering(fbnet, verbose=1)
# basic clustering with significance test
res2 = do.hierarchical.clustering(fbnet, verbose=1, random=100)
# hierarchical clustering with significance test (results in a hierarchy with two levels)
res3 = do.hierarchical.clustering(fbnet, random=100, recursive=TRUE, recrandom=100)
The last clustering can be interpreted by
by(res3$mod$modularity,res3$mod$type,max)
res3$mod$type: Original
[1] 0.5307591
-------------------------------------------------------------------------------------
res3$mod$type: Random
[1] 0.2525655
(showing that the clustering is actually significant compared to a random graph with similar a degree distribution) and
library(RColorBrewer)
my.pal = brewer.pal(8,"Set2")
par(mar=rep(0,4))
plot(fbnet,layout=layout.fruchterman.reingold, vertex.size=5, vertex.color=my.pal[res3$part[match(V(fbnet)$name,rownames(res3$part)),1]], vertex.frame.color=my.pal[res3$part[match(V(fbnet)$name,rownames(res3$part)),1]], vertex.label=V(fbnet)$initial, vertex.label.color="black", vertex.label.cex=0.7)
that displays the graph as shown at the beginning of this post.
</div>

