Analyse des SMS récupérés depuis un smartphone (Android / IPhone)SMS analysis (coming from an Android smartphone or an IPhone)
Ce tutoriel n’est disponible qu’en anglais…
At first, this post was intended to describe how to manipulate dates with R but, as the idea was coming from the question of one of my students who wanted to analyze his SMS, I thought that I might as well also explain the whole analysis process…
Using my new smartphone (that I started to use on June, 9th) and the apps SMS to text, I have extracted my SMS as a txt file (thank you, Nicolas, I wouldn’t even have had the idea of this post without you ^^). The file (where names were replaced by numbers, phone numbers deleted and message replaced by the number of characters of the sms by using sapply(...,nchar)) is available here (the file is named nv2_sms.txt). Also, Nicolas kindly provided me a sample of his own file, coming from an iPhone (to show different types of date format); the file is available here (and is named nae_sms.txt).
Importing the data into R
Data are imported by:
nv2.sms = read.table("nv2_sms.txt",header=F,sep="\t",stringsAsFactors=F)
names(nv2.sms) = c("date","hour","type","name","nchar")
nv2.sms$name = factor(nv2.sms$name)
nv2.sms$type = factor(nv2.sms$type)

nae.sms = read.table("nae_sms.csv",sep=",",header=T,row.names=1,stringsAsFactors=F)
Who am I texting with?
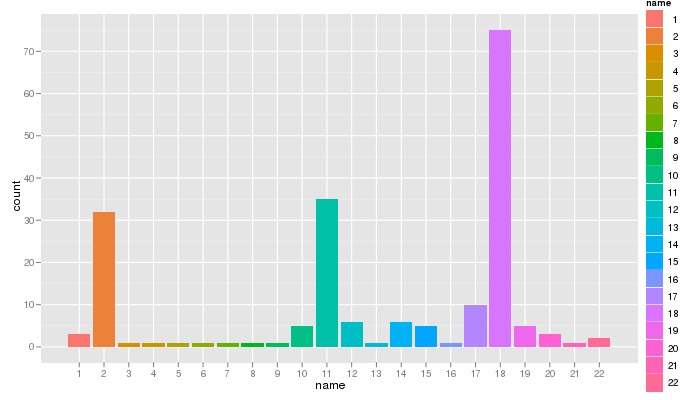
Using the ggplot2 package, I was able to display the number of SMS exchanged with each contact (contacts’ names were removed and replaced by numbers):
qplot(name, data=nv2.sms, geom="bar", fill=name)
and even to check if these messages were sent or received:
qplot(name, data=nv2.sms, geom="bar", fill=type)
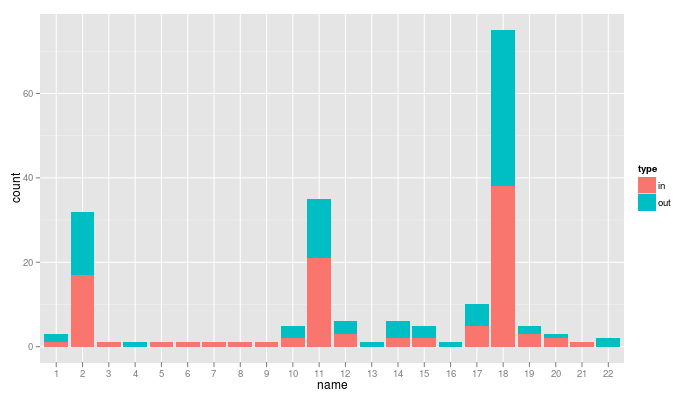
From these charts, are you able to guess which number is my husband, my mum, my sister, my friends, my colleagues, my students…? (if someone finds the first three of the previous list from the first guess, I promise a bottle of good wine, sent anywhere on earth)
To the point: manipulating dates
In my data, the dates are separated into two variables, nv2.sms$date and nv2.sms$hour. The first one is the day, month and year as in “2012-07-07” and the second one is the hour, minute and second as in “17:39:48”. The following lines concatenate both variables into a single one and use the function strptime to convert the result in a full date:
nv2.sms$fulldate = paste(nv2.sms$date,nv2.sms$hour,sep=", ")
nv2.sms$datePX = strptime(nv2.sms$fulldate,format="%Y-%m-%d, %H:%M:%S")
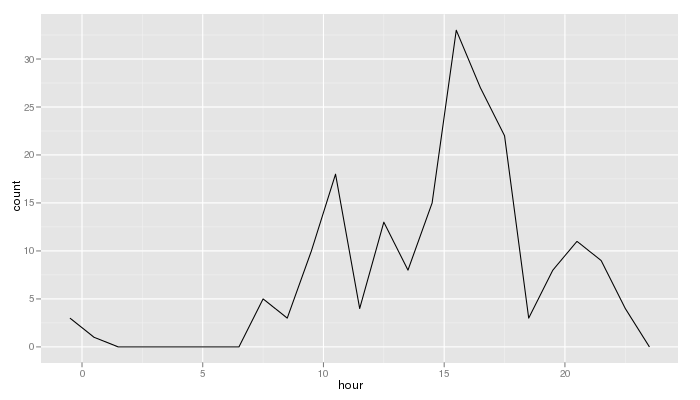
Then, any information can be extracted from the variable datePX with the function format as, for instance, the day of the week or the hour:
nv2.sms$weekday = format(as.POSIXlt(nv2.sms$datePX,origin="1970-01-01", tz="UTC"),"%A")
nv2.sms$weekday = ordered(nv2.sms$weekday,c("lundi","mardi","mercredi","jeudi","vendredi","samedi","dimanche"))
qplot(weekday, data=nv2.sms, geom="bar", fill=weekday)
nv2.sms$hour
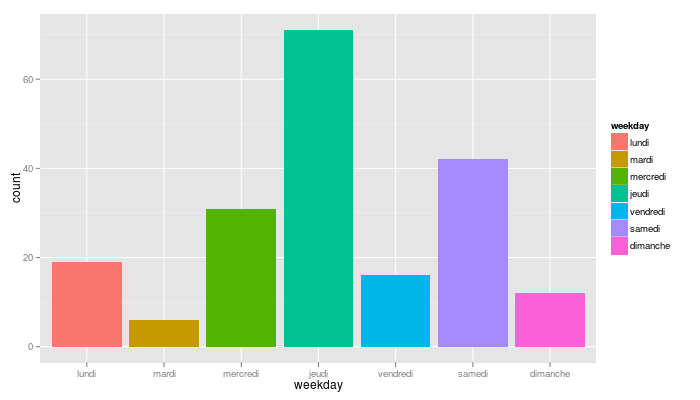
… where I learnt that I like texting on Thursday (can you guess why?)
The following command lines will help you display the evolution of your texting activity day by day. Each sms is linked to its day/month/year (the hour is set to 00:00:00 for all messages):
nv2.sms$year = format(as.POSIXlt(nv2.sms$datePX,origin="1970-01-01", tz="UTC"),"%Y")
nv2.sms$month = format(as.POSIXlt(nv2.sms$datePX,origin="1970-01-01", tz="UTC"),"%m")
nv2.sms$day = format(as.POSIXlt(nv2.sms$datePX,origin="1970-01-01", tz="UTC"),"%d")
nv2.sms$isodate = ISOdate(nv2.sms$year,nv2.sms$month,nv2.sms$day,"00","00","00")
qplot(isodate,data=nv2.sms,binwidth=5000)
In Nicolas’ data, the dates are included in the variable timestamp which looks like “Jul 28, 2010 6:36:04 PM”. Once again, the function strptime can be used to convert them into a proper date. Unfortunatly, dates are written by month name in English and my locale is… “fr_FR.utf8”!! (this is one of the wonderful things of working with data coming from an American… :-\ ). Setting the locale before the function solves the problem:
Sys.setlocale("LC_TIME","C")
nae.sms$datePX = strptime(nae.sms$timestamp, format="%b %d, %Y %I:%M:%S %p")
nae.sms$weekday = format(as.POSIXlt(nae.sms$datePX,origin="1970-01-01", tz="UTC"),"%A")
nae.sms$weekday = ordered(nae.sms$weekday,c("Monday","Tuesday","Wednesday","Thursday","Friday","Saturday","Sunday"))
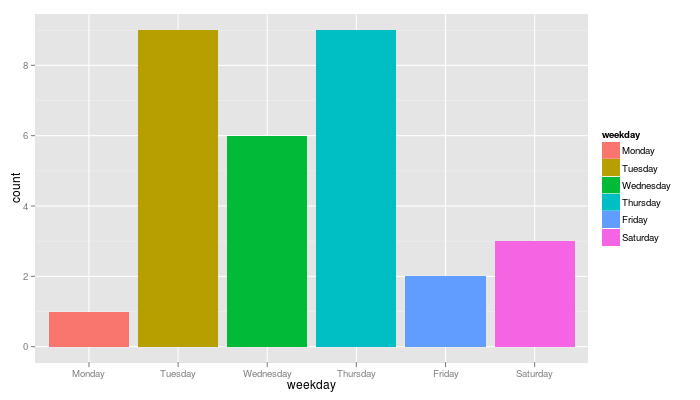
qplot(weekday, data=nae.sms, geom="bar", fill=weekday)

